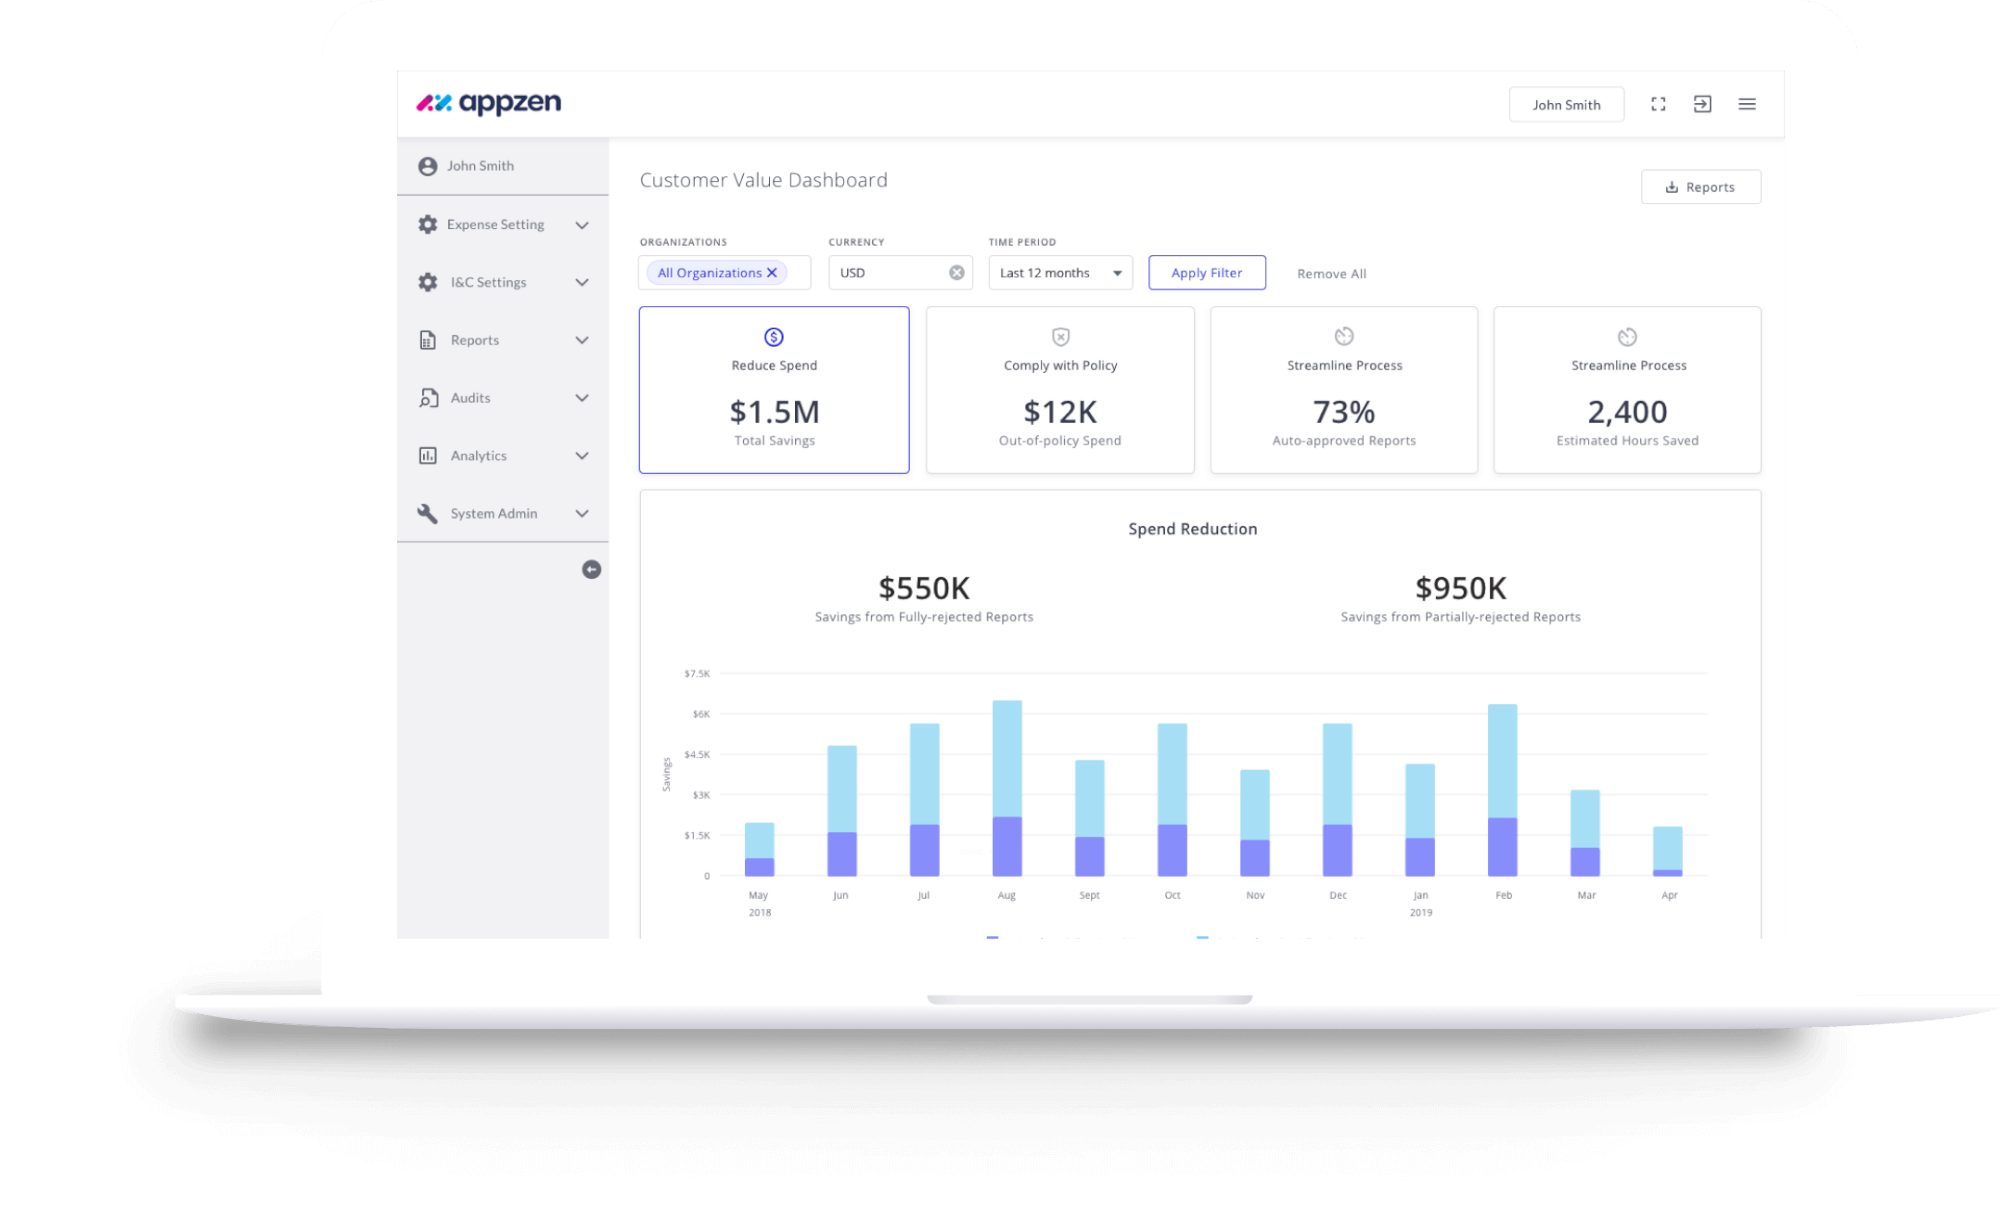
Displaying value through Analytics can put you on the fast track to meeting your business objectives and accelerating company growth. This two-part Analytics webinar series will walk you through AppZen’s dashboards, the variety of displayed charts, and the underlying data you can use to attain that value from your T&E spend.
In the first session, we:
-
Highlighted each of the AppZen value pillars and focus on Spend Avoidance
-
Walked through the spend-focused AppZen dashboards
-
Showed each of the underlying charts within AppZen Analytics for Expense Audit
Looking for the second session? Access the on-demand webinar here.
Related resources
Infographics
Top 8 areas of hidden-risk within expense processing
More
Infographics
How employees feel about company expenses during COVID-19
More
Infographics
The State of Business Spend Report - Q4 Infographic
More
Infographics
The State of AI in Business Spend Report - Q3 Infographic
More
Infographics
Expense account theft in the workplace with Peter Cappelli and Dan O'Meara
More
Infographics
How invoice auditing gets done: Then and now
More
Infographics
